

Filter differential pressure compares pressure before and after filter media. In a dust collector, that reading helps show how hard the fan must work to move air through loaded filters. It can support maintenance planning, but only when the team reads it with production context.
A rising number may mean the dust cake is building normally. It may also mean the cleaning system is weak, the dust has changed, compressed air is wet, filters are blinded, or a duct branch is sending more material than expected. A low number can also be suspicious if dust is escaping through leaks or bypassed filters.
Pressure Drop Is a Trend, Not a Guess
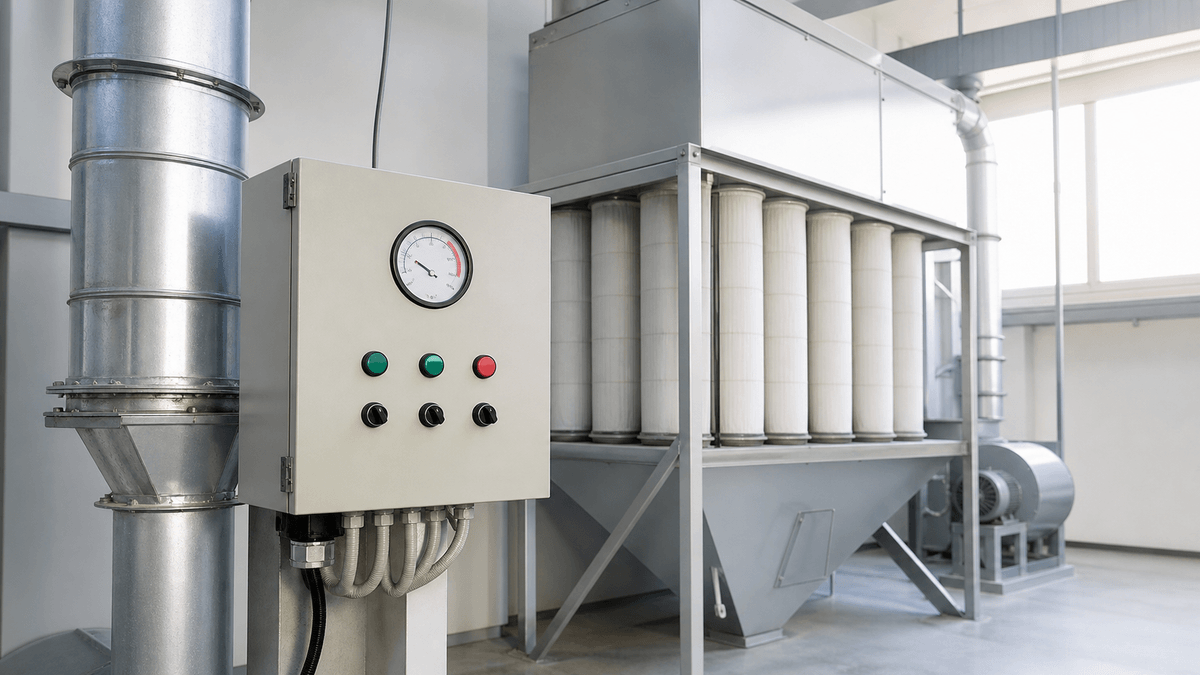
The useful question is not "what is the perfect number?" It is "what is normal for this collector under this process condition?" Baseline data should include clean-filter pressure, normal loaded pressure, fan speed, cleaning settings, production rate, and filter age.
NAROO's cartridge dust collector page is relevant because it connects filtration performance with airflow resistance, duct layout, pipe diameter, pressure loss, and air-to-cloth ratio. Those factors shape the pressure range that operators later see.
Filter Format Changes the Story
A cartridge collector, bag collector, cyclone-assisted system, and wet collection route will each create different normal readings. Heavy dust applications may point toward NAROO's bag dust collector, while coarse-particle streams may benefit from cyclone pre-separation before final filtration.
The pressure trend should therefore be interpreted by system type and process load. Copying a target number from another collector can lead to early filter changes or missed faults.
Use the Reading to Improve Maintenance
- Record differential pressure at the same process state each shift.
- Compare pressure recovery after cleaning cycles.
- Check compressed-air pressure and moisture for pulse systems.
- Inspect filter seating when pressure drops unexpectedly.
- Pair gauge readings with visible capture and housekeeping checks.
- Review duct and damper changes before blaming filter media.
High-Cleanliness Plants Need Stable Signals
In clean manufacturing environments, pressure instability can signal more than maintenance cost. Battery powder control, photovoltaic production, and laser processing may all require stable capture and predictable filtration. NAROO's lithium battery, photovoltaic, and laser processing application contexts help frame pressure readings as part of process control.
Gauge Placement and Tubing Can Mislead the Team
Before interpreting filter differential pressure, confirm that the measurement is trustworthy. Pressure taps should be installed in the right locations, tubing should be intact, and sensing lines should not be blocked by dust or moisture. A gauge with plugged tubing can show a steady reading while the collector is actually changing. A loose fitting can create a false low reading that delays maintenance.
Plants should include gauge and transmitter checks in the preventive maintenance plan. Inspect tubing, clean sensing ports where appropriate, verify zero, and compare local readings with controller data. If the plant uses a remote display, confirm that scaling and units are correct. Small instrumentation errors can create large maintenance mistakes when teams rely on one number.
This is especially important after a filter change, duct modification, or control-panel replacement. A system may appear to behave differently simply because the measurement point changed. Documenting the measurement setup keeps future troubleshooting grounded.
Cleaning Cycles Should Match Dust Behavior
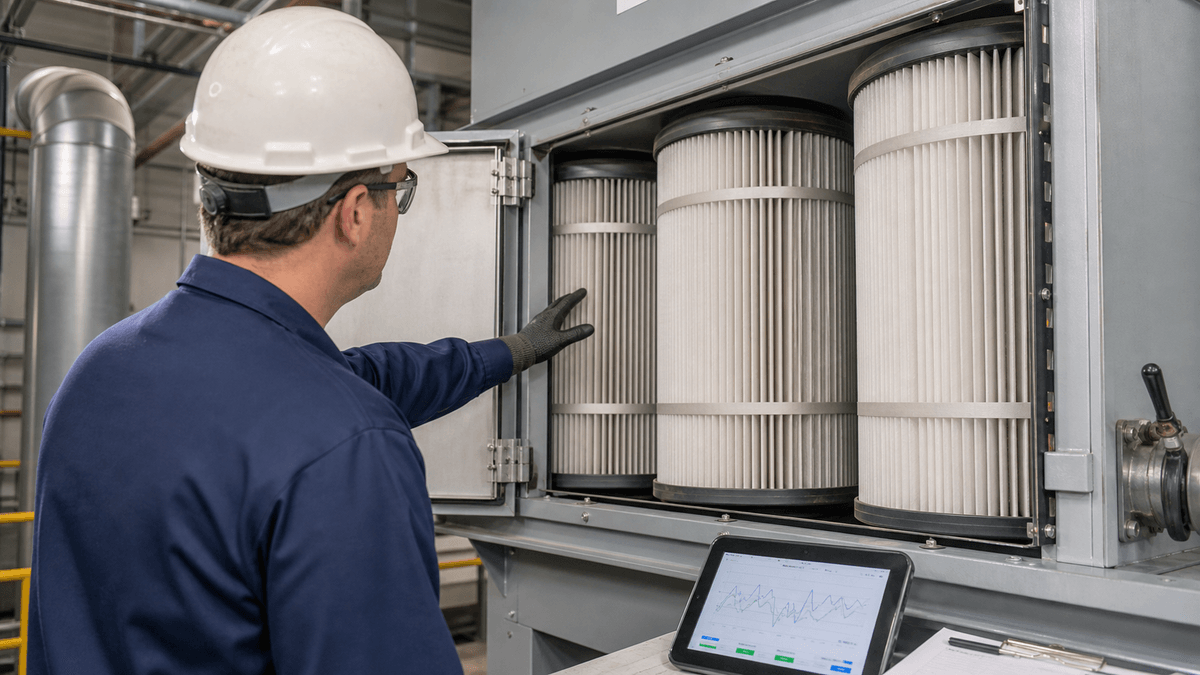
Pulse cleaning, reverse-air cleaning, and other filter-cleaning approaches are designed to control pressure drop without damaging the media or wasting energy. If cleaning is too weak, dust remains on the filters and pressure rises. If cleaning is too aggressive or too frequent, filters may wear faster, dust may re-entrain, and compressed-air cost may climb.
Dust behavior should guide the cleaning strategy. Fine dry dust may release differently from fibrous, moist, oily, or sticky particulate. Heavy process dust may require a different rhythm than light intermittent dust. A plant that copies cleaning settings from another collector may create unstable pressure behavior even with good filters.
Trend review should include pressure before cleaning, pressure after cleaning, recovery time, pulse frequency, compressed-air pressure, and dust conditions. If pressure recovery weakens gradually, the issue may be filter aging or dust blinding. If recovery changes suddenly, inspect valves, solenoids, air headers, and controller settings.
Pressure Drop and Energy Cost
Filter differential pressure also affects energy. As resistance rises, the fan must work harder to maintain airflow, or airflow declines if the fan cannot compensate. Either outcome has cost: higher energy use, weaker capture, reduced production confidence, or more frequent shutdowns for filter service.
Plants should not chase the lowest possible pressure without considering filtration. A very low reading can indicate leaks or bypass. The goal is a controlled operating range where capture is stable, filters are protected, cleaning is effective, and energy use is reasonable. That range should be based on the collector design and process needs.
NAROO's system-level product mix matters here because cartridge collectors, bag collectors, and cyclone-assisted systems have different pressure profiles. A cyclone may reduce filter loading but adds its own pressure loss. A larger filter area may reduce resistance but require more space. A compact system may fit the plant but need careful air-to-cloth planning.
When to Replace Filters and When to Investigate
Replacing filters is appropriate when media is damaged, blinded, aged, chemically attacked, or no longer recoverable through normal cleaning. But replacement should not be the automatic response to every high reading. If new filters quickly return to the same high pressure, the plant has not solved the root cause.
Investigate first when the pressure change follows a process change, raw material change, moisture event, compressed-air issue, duct modification, or visible dust surge. Inspect whether the dust cake is uniform, whether some filters are cleaner than others, and whether the hopper or inlet section shows signs of re-entrainment. Uneven evidence often points to airflow distribution rather than media life.
Filter replacement records should include reason for replacement, filter condition, pressure before and after, and any unusual findings. Over time, this creates a maintenance history that helps justify redesign, pre-separation, media review, or process changes.
Briefing a Supplier With Pressure Data
When asking for help, send a pressure trend instead of a single screenshot. Include collector type, filter type, filter age, dust source, operating schedule, cleaning settings, compressed-air pressure, fan details, and any recent process changes. Add photos of filter condition, inlet area, hopper discharge, hoods, and duct branches if possible.
A supplier can give better advice when the pressure reading is tied to symptoms. Is capture weak? Are filters failing early? Is energy use rising? Is dust escaping after cleaning pulses? Is the hopper plugging? These symptoms point to different causes even if the gauge number looks similar.
NAROO's engineering and installation background is most useful when pressure data is connected to the full dust-control route. The collector, ductwork, capture points, controls, and discharge path should be reviewed together.
Set Alarm Points With Operators in the Room
Alarm points should be useful to the people who respond to them. If a high-pressure alarm sounds every day during a normal production surge, operators may learn to ignore it. If the alarm point is too high, maintenance may not respond until capture has already weakened. The right alarm strategy should reflect real production, filter behavior, and the time needed to act.
Many plants benefit from two or three levels. A first alert can ask for a quick inspection of compressed air, hopper level, or unusual process dust. A second alarm can trigger maintenance scheduling. A critical alarm can require production review. Low-pressure alarms should also be included because they can indicate bypass, damaged filters, open access doors, or sensing-line failure.
Operators should know what each alarm means and what first checks are expected. The goal is not to turn every gauge reading into a crisis. The goal is to make filter differential pressure a shared maintenance language that production, EHS, and maintenance teams can act on consistently.
Use Pressure Data to Justify System Improvements
Good records make capital decisions easier. If pressure rises quickly after every filter change, the plant can show that the issue is not simply neglected maintenance. If pressure spikes during one material or process step, the team can focus on that source. If pressure remains high because dust reaches the final filters too aggressively, pre-separation, inlet changes, larger filter area, or duct redesign may be more cost-effective than repeated emergency filter purchases.
Pressure data also helps compare supplier proposals. One supplier may recommend more filter area, another may suggest a cyclone stage, and another may focus on hood capture. Historical data gives the plant a way to test those recommendations against actual symptoms. The strongest proposal should explain how the change will affect airflow, loading, cleaning recovery, energy use, and maintenance access.
For NAROO equipment discussions, this is where product selection and application engineering meet. A cartridge collector, bag collector, cyclone system, or wet collection approach should be connected to the pressure trend and the dust source, not selected because it is familiar.
The same records can also reduce unnecessary purchases. When teams can show that a pressure problem follows a moisture event, valve fault, duct change, or production surge, they are less likely to replace filters that still have useful life.
Conclusion
Filter differential pressure is useful because it turns invisible airflow resistance into a visible trend. Read it with production data, cleaning-system checks, filter inspections, and source-capture observations. The number matters, but the airflow story behind it matters more. A steady review routine keeps that story visible before performance slips.